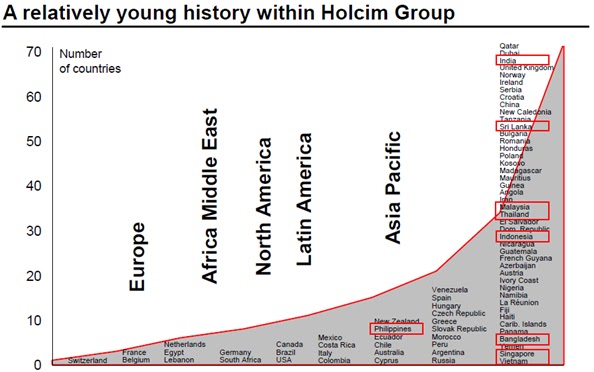
Company Profile
PT Holcim Indonesia, Tbk. or we will simply
call Holcim Indonesia on this paper is one of subsidiaries that are holded by
Holcim, Ltd. which has its headquarter in Switzerland, Europe. Simply, this
graph will show us the position of Holcim Indonesia within the international
group.
In ASEAN, Holcim Indonesia has been holding
important role in cement industry. Don’t forget also that both Holcim Indonesia
and Holcim, Ltd. are mainly operating in cement industry in manufacturing
industry sector.
In Indonesia, Holcim Indonesia offers these
product lines:
1. Cement: 10 types of
cement are offered with roughly 7 milllions of tonnes of annual production.
2. Solusi Rumah: as a
new paradigm in cement business by providing houseowner abundant information of
building, starts from its design, until the details of costruction.
3. Aggregates: as the
industry of constructional mining—from Maloko, West Java to Jeladri, until East
Java.
4. Concrete: service of
constructional cement equipments provided by Holcim Indonesia.
5. Geocycle: the CSRs
of Holcim Indonesia while working with infrastructional businesses, it utilizes
the experiences of how to maintain the natural resources even in modern ways.
Holcim Indonesia
Financial Performance
On this section, we will start looking into
the critical content of the paper. In financial science, we have known exactly
that there are lots of tools to use in analyzing the financial performance of a
certain company but in this chapter we will merely limit our analysis among
these three sub section:
A.
Relationship between
IHSG (Jakarta Composite Index) and Holcim Indonesia: Return and Beta Analysis
These simple data
and graph were gotten from public reports between period we chose to analyze
the company:
·
Return Analysis


From the both charts and tables above, we can
directly take conclusion that both of them are showing positive trend in the
historical data. For the mean only, we might count better in Holcim Indonesia,
rather than the market. Thus, in Holcim Indonesia’s stocks, we might expect
more for the long run investment purposes.
However, the standard deviation and the
charts histogram showed us the debate that it is riskier to invest in Holcim
Indonesia with bigger and wider range of return than IHSG. The below chart even
shows us how in the period (ex-post analysis), risks to bear in order to get
returns have been bigger for Holcim Indonesia. Then, we should ask too: “How much is the dependance of Holcim
Indonesia to the volatility of market (IHSG)? Is the wide range in Holcim caused by its volatility to the IHSG?”
|
|
Holcim
Indonesia
|
IHSG
|
|
COVARIANCE
|
21.62096106
|
15.09545527
|
·
Beta Analysis (with IHSG)
Answer to the
question can be answered by doing beta (β) analysis for Holcim Indonesia as independent variable (Y) and IHSG as
its dependant variable (X) in Eviews.

|
Method: Least Squares
|
|
|
||
|
Date: 11/05/12 Time:
15:13
|
|
|
||
|
Sample (adjusted): 1 690
|
|
|
||
|
Included observations: 690 after adjustments
|
|
|||
|
|
|
|
|
|
|
|
|
|
|
|
|
Variable
|
Coefficient
|
Std. Error
|
t-Statistic
|
Prob.
|
|
|
|
|
|
|
|
|
|
|
|
|
|
C
|
0.000940
|
0.000812
|
1.157609
|
0.2474
|
|
X
|
0.052986
|
0.064464
|
0.821943
|
0.4114
|
|
|
|
|
|
|
|
|
|
|
|
|
|
R-squared
|
0.000981
|
Mean
dependent var
|
0.000984
|
|
|
Adjusted R-squared
|
-0.000471
|
S.D.
dependent var
|
0.021273
|
|
|
S.E. of regression
|
0.021278
|
Akaike
info criterion
|
-4.859384
|
|
|
Sum squared resid
|
0.311497
|
Schwarz
criterion
|
-4.846234
|
|
|
Log likelihood
|
1678.488
|
Hannan-Quinn
criter.
|
-4.854298
|
|
|
F-statistic
|
0.675590
|
Durbin-Watson
stat
|
2.119793
|
|
|
Prob(F-statistic)
|
0.411394
|
|
|
|
|
|
|
|
|
|
|
|
|
|
|
|
Substituted Coefficients:
=========================
Y = 0.000939770978195 + 0.052986095495*X
First of all, we can
know the relationship between Holcim Indonesia and IHSG by testing them with
hypothesis testing:
1.
Hypothesis H0 : X = 0
H1 : X unequal 0
2.
T-critical = 1.647071412 (from Excel’s TINV formula)
3.
T-statistic
= 0.821943
(from Eviews table above)
4.
Thus, we reject H1 and conclude that IHSG as Beta (β) doesn’t significantly cause the
volatility of Holcim Indonesia stock returns.
Then, right after
figuring out that there is no significant relation between Holcim Indonesia and
IHSG, we can raise question: “So, what
influences the the risky movement of Holcim Indonesia stock return?”
Therefore, more fundamental analysis is required in the next comprehensions and
analysis point B and C.
B. Factors
that Influenced the Return Fluctuation of Holcim Indonesia Stock
After knowing that IHSG was not causing
Holcim Indonesia stock returns significantly, the major challenge we are having
is to determine and learn what are the risk we actually bear much from the
company. In order to analyze it, from the next page’s graph, we are going to
analyze the factors based on the “local period” trends that have been
distinguished or separated into 9 periods that we can simply judged from the
stock price graph, that must have finally constructed the stocks return. Every
major incident is hoped to be relevant enough to accomodate the appropriate
learning that we may have at the moment.
At the last part of this sub section of the
chapter, we will also look into account how the stock prices (reflected stock
returns) could be positively trending before concluding lessons we had from
them. I personally hope that these reports and comprehensions might give
broader view for all of the readers.

·
Period 1 (4 January – 26
April 2010): rapid and effective respose to the changing of external factors
during the year of 2009 was reavealed. Holcim, Ltd. was prepared for the market
slowdown after 2008 and in the beginning of 2009. Effective people development
programmes, debt and cost reductions were factors that influenced the high
expectation and rising values of the company. The 11.3% of sales rising was
surprisingly supported by 40% sales rises in concrete sales. Low inflation,
lower interest rate in the second half and strengthening Rupiah were supporting
factors that built positive sentiment for the strarting of 2010.
·
Period 2 (27 April – 21 May
2010): Execution of new cement plant in the eastern part of Java, near Tuban
which costed to around US$450 million was conducted. This attempt was done to
keep up the expected market growth. The new plant was hoped to further optimize
logistics costs and open up markets cost-efficiency in East Java, Kalimantan
and the eastern islands of Indonesia. Net sales and operating margin were also
revealed to grow in this period for Holcim Indonesia. However, heavy snowfall
and a weak economy unexpectedly limit construction activity in Europe and North
America. Even at this time, it was considered as difficult market environment
to grow, where Holcim exists in the regions too. At that time also, there was
an annual shareholders meeting that sounded not be that satisfied by the
devidend given by Holcim, but the meeting was held for the Holcim group,
Holcim, Ltd.
·
Period 3 (24 May – 7 December
2010): Stable volume development in all segments and increasing net sales –
operating EBITDA similar to the last year’s nine months when rapid recovery was
occured for the company, even as a whole. Demand of constructional materials
were all raising for emerging markets. Pressed prices was inevitable since low
fixed costs can be had but not for variable costs. There was reconstruction of
North America’s group’s interests. There was also special agreement with PT
Zurich Insurance Indonesia (ZII) to provide house insurance.
·
Period
4 (8 December 2010 – 14 March
2011): Holcim, Ltd. agreed to take plan to build new plants in France and
Switzerland for 8 locations to reach South Germany, Luxemburg, and the
Netherlands. However, by positive reports in ASEAN (even in Asia Pacific), the
group has planned to have additional constructional activities in Oceania in
the second half and is still confident that the Group will be successful in
securing its share of future growth in the emerging markets and that its lean
cost structures will enable it to benefit above average from a continuing
economic recovery in Europe and North America.
·
Period 5 (15 March 2011 – 20
July 2011): Dividends were distributed by withdrawing the 2010’s retainded
earnings with the reports of robust economic development in the emerging
markets. Inflation reduced cost pressure on raw materials and energy, as well
as strong Swiss franc, optimized the results to be significantly higher net
income.
·
Period 6 (21 July 2011 – 6
October 2011): Unexpectedly, Holcim Indonesia faced declining EBITDA, but report still showed higher net
income attributable to shareholders, the same factors happened in Latin
America, Asia Pacific, and Africa Middle East was down slightly compared to the
privious year because of downsiding movement off exchange rates among emerging
markets. Due to currency effects, consolidated net sales decreased by 7 percent
to CHF 10.1 billion and operating EBITDA declined by 19 percent to CHF 1.9
billion. The Group companies in Romania, Russia, Argentina, Thailand, Singapore
and Indonesia in particular positively influenced the result. At that moment,
Holcim still conducted the plant building in Brazil to increase its production
capacity.
·
Period 7 (7 October 2011 – 9
May 2012): Holcim 100 year’s anniversary evaluation of development and CSRs.
Continuable Bali projects added by two more innovative products by Holcim
Indonesia. Record sales was held and final Rp55/share dividend is announced.
Clear plant chedule of 1.7 million tonnes in Tuban factory. Domestic market
penetration raised and regional supply capability was proven to be run well.
For example, some Middle Sumatra projects were finished during the period by
using Holcim Indonesia’s group supplies.
·
Period 8 (10 May 2012 – 1
June 2012): Holcim provided CSRs to build 300 homes for low-income families in
Indonesia. The movement was also going in other emerging markets countries.
·
Period 9 (19 September 2012 –
19 October 2012): Indonesian
Environment Week 2012 or Pekan Lingkungan Indonesia (PLI) 2012 involves a
series of events held to promote World Environment Day, including the highlight
of the celebration at the State Palace on June 5. One of the key objectives of
PLI is to raise awareness of the environment. In order to achieve a broader
traction, future events will no longer focus on Jakarta and involve more
stakeholders in more regions. Higher operating EBITDA and higher cement volume,
better prices, also growth were supportive to all better margin for the Holcim
Indonesia with increasing shareholders’s value in increasing level. Moreover,
Holcim Indonesia attributed to lots of help for disables.
One thing that we might agree by seeing the occurances and the movement
of Holcim Indonesia’s stock prices is that the movements themselves somehow
were influenced by the investors’ behaviors. Thus, whether or not we use
‘proper’ behavioral analysis in finance, we might see some conditions that was
confirmed by the fluctuation of the stock prices (reflected the stocks
returns):
·
Holcim
Indonesia is a tough / aggresive company that wants to develop by so many
projects. Such a choice rather than being steadily improving may resulted in
next points.
·
Recall,
covariance (risk and return trade-off) of Holcim Indonesia is bigger than the
market.
·
The
behaviors of investors was obvously influenced by many foreign condition of
Holcim, Ltd. movements (can answer why it is significantly dependant with IHSG)
and currency risks accross countries, especially the condition of exchange
rates.
·
Investors
tend to be sensitive when:
o
The
company is taking projects (negatively)
o
The
company pays dividends (positively)
o
The
company almost finishes projects (positively)
o
The
exchange rates accross Holcim Ltd. changes (positively or negatively)
C. Analysis of Business Risks
Instead of merely concerning about how the stock prices fluctuated in
certain samples of period, as information seekers, we should develop broader
understanding about how the company has managed its businesses by take its
Financial Statements into account. One of most powerful tools to evaluate the
Financial Statements is when we discuss about the company’s Financial Ratios.
|
Summary of Financial Ratios
|
||||||
|
Holcim Indonesia, Tbk.
|
||||||
|
Category
|
2007
|
2008
|
2009
|
2010
|
2011
|
|
|
Liquidity Ratio
|
|
|
|
|
|
|
|
|
Current Ratio
|
1.332537
|
1.683279
|
1.269922
|
1.661888
|
1.465835
|
|
|
Quick Ratio
|
1.092369
|
1.345161
|
0.941218
|
1.293164
|
1.127042
|
|
|
Cash Ratio
|
0.641998
|
0.838355
|
0.370322
|
0.818776
|
0.708335
|
|
Efficiency Ratio
|
|
|
|
|
|
|
|
|
Inventory T/R
|
9.466971
|
7.586322
|
9.667207
|
7.423563
|
8.190659
|
|
|
Day's Sales in Inventory
|
38.5551
|
48.11291
|
37.75651
|
49.16777
|
44.56296
|
|
|
A/R T/R
|
7.604426
|
8.288687
|
8.955796
|
9.267229
|
10.672
|
|
|
Average Collection Period
|
47.99836
|
44.03593
|
40.75573
|
39.3861
|
34.20164
|
|
|
Total Asset Turnover
|
0.520918
|
0.625849
|
0.818112
|
0.571088
|
0.687089
|
|
|
Fixed Asset Turnover
|
0.658843
|
0.853004
|
1.083402
|
0.75282
|
0.911564
|
|
Leverage Ratio
|
|
|
|
|
|
|
|
|
Debt Ratio
|
0.68656
|
0.669325
|
0.543563
|
0.345996
|
0.31261
|
|
|
Debt to Equity Ratio
|
2.19234
|
2.024115
|
1.191347
|
0.529306
|
0.454779
|
|
|
Equity Ratio
|
0.313163
|
0.330675
|
0.456259
|
0.653679
|
0.68739
|
|
|
Equity Multiplier
|
3.193226
|
3.024115
|
2.191737
|
1.529803
|
1.454779
|
|
|
Times Interest Earned Ratio
|
2.584473
|
2.474226
|
3.915298
|
5.930663
|
8.967248
|
|
Profitability Ratio
|
|
|
|
|
|
|
|
|
Gross Profit Margin
|
0.336121
|
0.389377
|
0.378495
|
0.377372
|
0.378993
|
|
|
Operating Profit Margin
|
0.081016
|
0.106033
|
0.293052
|
0.231651
|
0.229361
|
|
|
Net Profit Margin
|
0.045117
|
0.058754
|
0.153486
|
0.139312
|
0.141356
|
|
|
Operating Income ROI
|
0.042203
|
0.066361
|
0.239749
|
0.132293
|
0.157591
|
|
|
ROA
|
0.023502
|
0.036771
|
0.125569
|
0.079559
|
0.097124
|
|
|
ROE
|
0.075048
|
0.111201
|
0.275214
|
0.12171
|
0.141294
|
Actually, it could be nice whenever we evaluate them all and that I
found out that it is really true that this company is an aggresive and can be
called as ‘risk-taker’ if it were an investor. The results are amazing from 5
consecutive years backward even though the passing global economic crisis. On
top of those discussions, these line might be said as the best ratios in order
to describe how the business risks of the company have been plotted.

In my opinion, there are lots of good things here. The most visible one
is the times interest earned ratio. It is obvious that the ratio is in line
with debt ratio too, but in the essence we can say that the significance of
getting operations done without any distraction of paying interests are greater
for this company (or in other word is ‘interest
independence’). One more good news for us is that those good ratios didn’t
reduce the ability of this company in generating profits. Fast recovery in 2009
still led Holcim Indonesia gets stable positive profitability. In financial
ratios point of views’ we can simply say that this company performed well, even
though such aggresive expectations may lead into high volatility of stocks
prices and returns movements. But, the good thing is that all of investments
(equity) to this company I am sure going to be positive in the long run.

Remember also, that beacuse this Holcim Indonesia has lots of
international investment and operations activities, we might be assured that
the portfolio systematic and unsystematic risks of the company are lower than
others commonly in Indonesia (recall: IHSG doesn’t significantly influence
Holcim Indonesia).
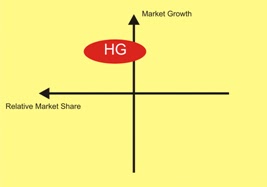
BCG Matrix Analysis
A.
Theoretical Review
At the moment we are
going to use BCG Matrix analysis in line with the intention with its founder,
Bruce Henderson for Boston Consulting Group in order to help people analyzing
business units or product lines within each company.

As shown above, BCG
matrix uses two-way axis: market / industry growth and relative market share
among the industry. Therefore, we have 4 quadrants built by the intersection
spaces among the two-way axis:
·
Cash Cows: refers to a company that can be judged to
have high relative market share but in slow industry growth. Thus, it looks
boring to be stagnantly in the one industry only. There can be opportunities of
getting profits in others.
·
Dogs: refers to company unfavorably to have. It has
significantly small relative market share, moreover in a slow growth industry.
·
Question Marks: refers to company that should have
more added-values to win the market which is in condition where fast industry
growth is experienced but in small relative market share.
·
Stars: refers to company that has bright future. It
is the most favorable where fast industry growth and big relative market share
are both experienced.
A.
BCG Matrix for
Holcim Indonesia
On this sub section,
in order to give us all rough but countable information about Holcim Indonesia,
I would like to distribute the results of my personal BCG Matrix Analysis for
the company into three layers:
·
Holcim, Ltd.

This is for Holcim Ltd. from my personal BCG Matrix. Based on next
page’s graph, it is obvious for us that this company has been able to define
all the time where the direction of infrastructional developments are
happening. Until now, Holcim, Ltd. is one of the biggest producers of cement in
the world. More over, not only about its size, but the profitability of this
company even could be managed time by time. Until it reached the time of slow
cement industry in developed countries to be refreshed in emerging countries.
·
Holcim Indonesia,
Tbk.
|
National Cement Industry Market Share
2010
|
|||
|
No.
|
Producers
|
Capacity
(million tonnes)
|
%
|
|
1
|
Semen
Gresik Group
|
20.2
|
37.0642202
|
|
2
|
Indocement
TP
|
18.6
|
34.1284404
|
|
3
|
Holcim
Indonesia
|
8.5
|
15.5963303
|
|
4
|
Semen
Bosowa
|
3.8
|
6.97247706
|
|
5
|
Semen
Andalas
|
1.6
|
2.93577982
|
|
6
|
Semen
Baturaja
|
1.3
|
2.3853211
|
|
7
|
Semen Kupang
|
0.5
|
0.91743119
|
|
|
TOTAL
|
54.5
|
100
|
|
(sumber: Asosiasi Semen Indonesia)
|
|||
|
Mean
|
7.785714286
|
||
|
Standard
Deviation
|
8.375246976
|
||
|
t-critical
|
2.015048372
|
||
|
t-test
|
-0.225643777
|
||
With CIA’s data of around 30%
budget is allocated to investments and previous page’s tables, we may know that
the growth for this market is high and even though we still reject the
hypothesis that Holcim Indonesia is significantly different at 95% confidence
level. This chart may give the BCG Matrix Analysis.

·
Holcim Indonesia’s
Business Units
o Cement:
o Solusi Rumah:

o Aggregates:

o Concrete:

For Cement and Aggregate, Holcim has been known as the specialist of
them among few producers in Indonesia as the keys to follow the rapid growing
of Indonesian ifrastructional development. Of course, by the enforcement of
governmental policies to develop it, any kind of industry / businesses related
to infrastructures will be growing too.
That’s why we can assume that for concrete and solusi rumah’s market growth are
promising, even though solusi rumah is still new and need to be supported,
while concrete is only reserve production projects of Holcim, since not in
every projects the equipments are always used.
Conclusion
Taking relationship
between company and market stock return and beta (β); elaboration more fundamental anlysis; and BCG
Matix Analysis into account are sufficient enough to highlight how certain
company has performed historically in order to get understanding how to invest
our company’s capitals. Unfortunately, right after figuring out that there is
no significant relation between Holcim Indonesia and IHSG, we should rely more
in simple fundamental analysis and BCG Matrix.
Then, after classifying Holcim Indonesia’s
ex-post analysis into 9 periods, some behaviors of investors were seen, even
though Holcim Indonesia is believed to give good long run profit. The movement of Holcim Indonesia’s stock
prices is that the movements themselves somehow were influenced by the
investors’ behaviors. Thus, whether or not we use ‘proper’ behavioral analysis
in finance, we might see some conditions that was confirmed by the fluctuation
of the stock prices (reflected the stocks returns):
·
Holcim
Indonesia is a tough / aggresive company that wants to develop by so many
projects. Such a choice rather than being steadily improving may resulted in
next points.
·
Recall,
covariance (risk and return trade-off) of Holcim Indonesia is bigger than the
market.
·
The behaviors
of investors was obvously influenced by many foreign condition of Holcim, Ltd.
movements (can answer why it is significantly dependant with IHSG) and currency
risks accross countries, especially the condition of exchange rates.
·
Investors
tend to be sensitive when:
o
The
company is taking projects (negatively)
o
The
company pays dividends (positively)
o
The
company almost finishes projects (positively)
o
The
exchange rates accross Holcim Ltd. changes (positively or negatively)
The most interesting ratio is the times interest earned ratio. It is
obvious that the ratio is in line with debt ratio too, but in the essence we
can say that the significance of getting operations done without any
distraction of paying interests are greater for this company (or in other word
is ‘interest independence’). One more
good news for us is that those good ratios didn’t reduce the ability of this
company to generate profits. Fast recovery in 2009 still led Holcim Indonesia
gets stable positive profitability. In financial ratios point of views’ we can
simply say that this company performed well, even though such aggresive
expectations may lead into high volatility of stocks prices and returns
movements. But, the good thing is that all of investments (equity) to this
company I am sure going to be positive in the long run.
Remember also, that beause this Holcim Indonesia has lots of
international investment and operations activities, we might be assured that
the portfolio systematic and unsystematic risks of the company are lower than
others commonly in Indonesia (recall: IHSG doesn’t significantly influence
Holcim Indonesia).
For the business units, Holcim Indonesia is
still one of the biggest producers in Indonesia, supported by 2 main business
units and 2 additional business units (concrete is to utilize equipment and
solusi rumah is to penetrate the growing market, while we might consider
geocycle as its CSRs, not the core products.
Thus, for all I am really satisfied by Holcim
Indonesia and I can take a lesson personally that this company is risky to be
invested only in short-term contract, but if it is in long run, I believe that
it is going to be better off, especially when the company has no signifficant
systematic risks in IHSG. Thus, it became a preferable choice of portfolio of
investment. God bless you all.
References
Adhy, Susilo. 2009. Analysis BCG
Matrik pada Suatu Perusahaan. [slam’s] son blog
Gujarati. Basic Econometrics.
Ross. Corporate
Finance Fundamentals